It has long been acknowledged that reported scores on the Tennessee Comprehensive Assessment Program (TCAP) are among the most inflated in the country. In fact, the U.S. Chamber of Commerce recently gave Tennessee an ‘F’ when ranking states’ truth in advertising for reporting K-12 outcomes.
Recognizing that more reliable reporting was needed, the Tennessee State Board of Education has adopted the scoring model of the National Assessment of Educational Progress (NAEP), a more rigorous national assessment (also known as “America’s Report Card”). It is not known whether the state will adopt the exact reporting standards used by NAEP; however, it is widely expected that the percentages of students reaching proficiency on the 2010 TCAP will be substantially lower than those reported in 2009.
Given this likelihood, the Education Consumers Foundation commissioned a study to see how schools
and districts would fare if their current TCAP scores were converted to the standards set by NAEP. It allows the public and their representatives, including school board members and legislators, to get a clear sense of the magnitude of the coming changes and begin addressing performance issues in order to improve student outcomes.
Introduction and Overview
This document (PDF format) provides an overview of the analysis along with top-line results.
Tennessee vs. Selected Averages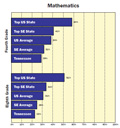
Groups like Tennessee SCORE have suggested a five-year goal of having Tennessee become the highest-achieving state in the southeast. This chart, using data from the 2007 NAEP, shows how the state stacks up against the Southeastern average, the top-performing state in the region, the national average, and the top-performing state in the country. This chart (PDF format) includes an analysis of 4th and 8th grade mathematics and 4th and 8th grade reading/language arts.
List of Districts (Grades 4/8) and High Schools 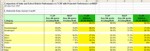
Provided as an Excel spreadsheet (click here for sheet), this document allows users to look at the current levels of grade inflation among districts based on 4th and 8th grade composite mathematics/reading-language arts scores as well as that of individual high schools.
See Your District’s Results 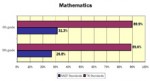 If you’d like to see how your district’s scores on the TCAP translate to NAEP standards in 4th and 8th grade mathematics and reading/ language arts, select your district from the menu below; charts will open up as a PDF file.
Finally, for those who wish to see details of how the calculations were made, you can download this technical report (PDF format) from Asora Education Services.
If you have any questions or comments, or would like to review the technical paper on the methodologies that produced this analysis, please feel free to contact us through our contact page; a representative of the foundation will contact you shortly .