Comparing third grade reading proficiency among Virginia schools and districts
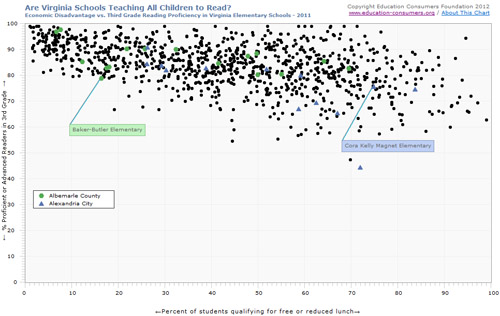
Each dot represents a school. The closer to the top, the greater the percentage of its third-grade students that are proficient in reading. The farther to the right, the greater the percentage of its students that are economically disadvantaged.
Note that each state chooses its own assessment of student achievement and that the charts linked below represent the most recent VA data available online.
Also note that most states follow the National Assessment of Educational Progress’s practice of dividing student achievement into four levels—Advanced, Proficient, Basic, and Below Basic.
Advanced and Proficient are considered “proficient” levels of performance. Basic and Below Basic are considered below-proficient levels of performance.
Virginia divides its student achievement outcomes into fewer levels but is apparently undertaking major revision. For the years up to and including 2024, VA has publicly highlighted two levels of school and district reading achievement data: Passed and Advanced.
Those reports did reveal certain minimal facts about schools and districts, and it did permit users to infer that the remaining percentage of students performed at a failing level. They are somewhat misleading, however.
Beyond the primary data reports, inquiring users were able to find additional detail by following several links available via the Virginia School Profiles page and selecting the “Show Data” icon. The data revealed via the Show Data link did show the percentage of students who are Proficient in reading—the metric on which the NAEP and most states base their assessment of school quality.
Unfortunately, VA’s method of compiling the percentage of “Proficient” students continues to differ substantially from that of other states and produces a substantially inflated result. Proficient, as VA uses the term, includes a large number of students who have earned a “Passing” score but one that NAEP and most states would consider to be at the “Basic” level.
VA is in the process of revising its student performance-level descriptors such that they will include four levels. The top two levels are treated as passing and the lower two treated as failing: Pass/Advanced, Pass/Proficient, Fail/Basic, and Fail/Below Basic– four categories that more closely conform with the four levels used by the NAEP.
In anticipation of this change, ECF has adjusted VA’s currently reported reading outcomes to the four-level model in order that our displays of their reading proficiency outcomes will be more comparable to other states. See the User Alert below.
Available charts:
- Proficient and Advanced: Poverty versus 3rd grade reading proficiency (2024)
- Proficient and Advanced: Poverty versus 3rd grade reading proficiency (2023)
- Proficient and Advanced: Poverty versus 3rd grade reading proficiency (2022)
- Proficient and Advanced: Poverty versus 3rd grade reading proficiency (2021)
- Advanced only: Poverty versus 3rd grade reading proficiency (2021)
- Proficient and Advanced: Poverty versus 3rd grade reading proficiency (2019)
- Advanced only: Poverty versus 3rd grade reading proficiency (2019)
- Proficient and Advanced: Poverty versus 3rd grade reading proficiency (2018)
- Advanced only: Poverty versus 3rd grade reading proficiency (2018)
- Proficient and Advanced: Poverty versus 3rd grade reading proficiency (2017)
- Advanced only: Poverty versus 3rd grade reading proficiency (2017)
- Proficient and Advanced: Poverty versus 3rd grade reading proficiency (2016)
- Advanced only: Poverty versus 3rd grade reading proficiency (2016)
- Proficient and Advanced: Poverty versus 3rd grade reading proficiency (2014)
- Advanced only: Poverty versus 3rd grade reading proficiency (2014)
- Proficient and Advanced: Poverty versus 3rd grade reading proficiency (2013)
- Advanced only: Poverty versus 3rd grade reading proficiency (2013)
- Proficient and Advanced: Poverty versus 3rd grade reading proficiency (2011)
- Advanced only: Poverty versus 3rd grade reading proficiency (2011)
User Alert for 2022 and subsequent charts:
ECF’s conversion of VA’s three category reporting into a NAEP equivalent is accomplished by subtracting VA’s statewide percentage of Advanced students (11%) from its 67% of Passed students and dividing the remaining 56% of students into the Proficient and Basic categories using the NAEP’s proportions of Proficient (23%) and Basic (28%) as a guide.
Given that 23%+28% constitutes 100% of VA’s Proficient and Basic students according to the NAEP, it is reasonable to justify dividing the remaining 56% of VA’s Passing students into Proficient and Basic by the same proportions, i.e., VA Proficient = 23%/(23%+28%) x 56% = 25% and VA Basic = 28%/(23%+28%)x56% = 31%. VA’s percentage of Failed students (33%) is treated as NAEP’s Below-Basic.
In summary, ECF’s adjusted percentage of VA’s Proficient third graders is the sum of a school’s Advanced percentage plus 25% of the school’s remaining Passing percentage. The resulting state average of Proficient third graders is 11% (Advanced) plus 25% (Proficient) which equals 36%. These numbers are far more in line with the NAEP-reported percentages of VA students that are proficient in 4th grade reading.
User Alert for 2018 charts and 2019 charts: In a small number of schools, proficiency was reported as <50% or >50%. These were changed to whole numbers for graphing purposes.
User Note for 2019 and 2021: Compared to the scores reported by the National Assessment of Educational Progress (NAEP), the proficiency percentages reported by Virginia appear to be inflated. The independent NAEP reports 39% of the state’s 4th grade students to be proficient or above in reading. Virginia is reporting close to 71% for 2019 and 61% for 2021.
User Note for 2017 and 2018: Compared to the scores reported by the National Assessment of Educational Progress (NAEP), the proficiency percentages reported by Virginia appear to be inflated. The independent NAEP reports 43% of the state’s 4th grade students to be proficient or above in reading. Virginia is reporting close to 79% for 2017 and 76% for 2018.
User Alert for 2014 charts: Compared to the scores reported by the National Assessment of Educational Progress (NAEP), the proficiency percentages reported by Virginia appear to be inflated. The independent NAEP reports 45% of the state’s 4th grade students to be proficient or above in reading. Virginia is reporting close to 69%.
In order to provide users a chart containing more realistic estimates of local school performance, ECF has created a second chart showing the percentage of students reaching the state’s “Advanced” standard–a standard more nearly comparable to the NAEP’s “Proficient” level of performance.
User Alert for 2013 charts: Compared to the scores reported by the National Assessment of Educational Progress (NAEP), the proficiency percentages reported by Virginia appear to be inflated. The independent NAEP reports 45% of the state’s 4th grade students to be proficient or above in reading. Virginia is reporting close to 73%.
In order to provide users a chart containing more realistic estimates of local school performance, ECF has created a second chart showing the percentage of students reaching the state’s “Advanced” standard–a standard more nearly comparable to the NAEP’s “Proficient” level of performance.
 Comparing Virginia’s Proficiency Standards to the National “Gold Standard” (NAEP)
Each state defines for itself what “proficient” means; some states have a rigorous definition, while others are less strict in their standards. To see how states compare, ECF has published charts showing the percentage of students deemed proficient in various subjects and grade levels and compared them to percentages reported for each state by the National Assessment of Educational Progress (NAEP, or “The Nation’s Report Card”), considered to be the gold standard.