North Carolina: Comparing schools and districts based on student proficiency
The information below reflects the most recent data available to us; please contact us with questions or to request additional analyses.
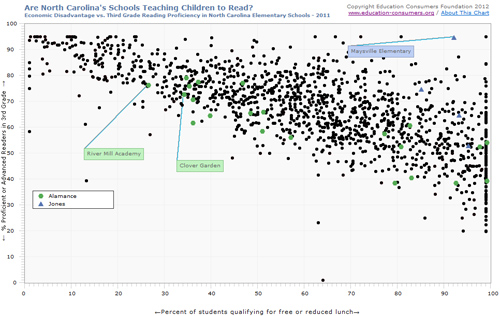
Analysis: Comparing schools and districts on third grade proficiency in reading and math
The charts linked below allow you to compare schools and districts in North Carolina with their peers. The Y (vertical) axis shows the percentage of proficient 3rd graders in a subject; the X (horizontal) axis shows the percentage of students who qualify for the free or reduced rate lunch program, a common indicator of poverty in schools.
Available charts:
- Grade Level Proficient (2024)
- College and Career Level Proficient (2024)
- Grade Level Proficient (2022)
- College and Career Level Proficient (2022)
- Grade Level Proficient (2021)
- College and Career Level Proficient (2021)
- Poverty versus 3rd grade reading proficiency rates (2019)
- Poverty versus 3rd grade reading proficiency rates (2018)
- Poverty versus 3rd grade reading proficiency rates (2017)
- Poverty versus 3rd grade reading proficiency rates (2016)
- Poverty versus 3rd grade reading proficiency rates (2015)
- Poverty versus 3rd grade reading proficiency rates (2013)
- Poverty versus 3rd grade reading proficiency rates (2011)
- Poverty versus 3rd grade math proficiency rates (2011)
Note: For the 2021 chart, economically disadvantaged data from 2019 was used.
Note: Compared to the scores reported by the National Assessment of Educational Progress (NAEP), the proficiency percentages reported by North Carolina as Grade Level Proficient appear to be inflated. The independent NAEP reports 36% of the state’s 4th grade students to be proficient or above in reading. North Carolina is reporting close to over 45% Grade Level Proficient and 34% College and Career Ready Proficient for 2021. In order to provide users more realistic estimates of local school performance, ECF has created two charts, one showing the percentage of students reaching the state’s “Grade Level Proficient” standard and another showing the percentage of students reaching the state’s “College and Career Level Proficient” standard.
Note: For the 2016 chart, ED data was calculated by dividing the number of third grade ED students who took the test by the total number of third grade students who took the test. In a small number of schools where this data was masked, 2017 ED data was substituted.
Note: North Carolina reports five levels of proficiency. The top two levels of proficiency, levels 4 and 5, were used to calculate proficiency for the 2015-2019 and subsequent charts. The NC Department of Education refers to this as “College and Career Ready” proficiency as opposed to the top three levels of proficiency which they refer to as “Grade Level Proficiency”.
Note: Because of the North Carolina Department of Education’s interpretation of federal privacy laws, reading proficiency data is suppressed for all schools above 95% or below 5%. We have placed schools scoring 95% at the 95% line and <5% at the 5% line. See here for more information.
 Comparing North Carolina’s Proficiency Standards to the National “Gold Standard” (NAEP)
Each state defines for itself what “proficient” means; some states have a rigorous definition, while others are less strict in their standards. To see how states compare, ECF has published charts showing the percentage of students deemed proficient in various subjects and grade levels and compared them to percentages reported for each state by the National Assessment of Educational Progress (NAEP, or “The Nation’s Report Card”), considered to be the gold standard.