South Dakota: Comparing schools and districts based on student proficiency
The information below reflects the most recent data available to us; please contact us with questions or to request additional analyses.
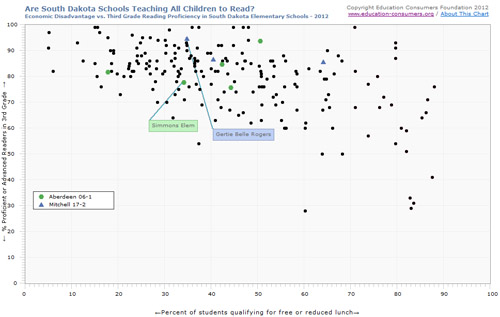
Analysis: Comparing schools and districts on third grade proficiency in reading and math
The charts linked below allow you to compare schools and districts in South Dakota with their peers. The Y (vertical) axis shows the percentage of proficient 3rd graders in a subject; the X (horizontal) axis shows the percentage of students who qualify for the free or reduced rate lunch program, a common indicator of poverty in schools.
Available charts:
- Poverty versus 3rd grade reading proficiency rates (2023)
- Poverty versus 3rd grade reading proficiency rates (2019)
- Poverty versus 3rd grade reading proficiency rates (2018)
- Poverty versus 3rd grade reading proficiency rates (2017)
- Poverty versus 3rd grade reading proficiency rates (2016)
- Poverty versus 3rd grade reading proficiency rates (2015)
- Poverty versus 3rd grade reading proficiency rates (2013)
- Poverty versus 3rd grade reading proficiency rates (2012)
- Poverty versus 3rd grade reading proficiency rates (2011)
Note: For some South Dakota schools, ** Indicated a Free and Reduced Percentage more than 90%; in these schools, the whole number 90% was substituted for graphing purposes.
Note: In 2015 South Dakota joined the Smarter Balanced Assessment Consortium which created an assessment that is fully aligned with the Common Core State Standards. Since the student test scores released establish a new baseline aligned with the Common Core, they should not be compared to previous statewide test scores.
 Comparing South Dakota’s Proficiency Standards to the National “Gold Standard” (NAEP)
Each state defines for itself what “proficient” means; some states have a rigorous definition, while others are less strict in their standards. To see how states compare, ECF has published charts showing the percentage of students deemed proficient in various subjects and grade levels and compared them to percentages reported for each state by the National Assessment of Educational Progress (NAEP, or “The Nation’s Report Card”), considered to be the gold standard.