North Dakota: Comparing schools and districts based on student proficiency
The information below reflects the most recent data available to us; please contact us with questions or to request additional analyses.
Available charts:
- Poverty versus 3rd grade reading proficiency rates (2023)
- Poverty versus 3rd grade reading proficiency rates (2019)
- Poverty versus 3rd grade reading proficiency rates (2018)
- Poverty versus 3rd grade reading proficiency rates (2017)
- Poverty versus 3rd grade reading proficiency rates (2016)
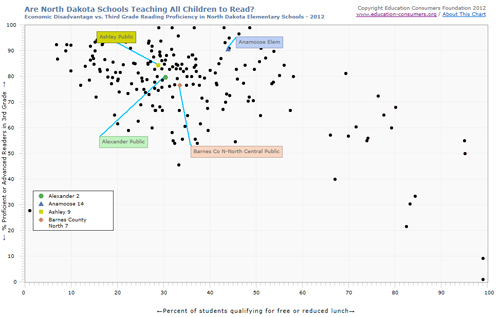
- Poverty versus 3rd grade reading proficiency rates (2012)
Note: For 2018 and subsequent charts, the percentage of students in each proficiency level was reported as a range. The midpoint of each level was used to calculator proficiency for graphing purposes.
Note: In the case of missing percentages for proficiency or if proficiency data was reported as a range, ECF estimated the missing numbers in the proportions suggested by the state NAEP distribution.
 Comparing North Dakota’s Proficiency Standards to the National “Gold Standard” (NAEP)
Each state defines for itself what “proficient” means; some states have a rigorous definition, while others are less strict in their standards. To see how states compare, ECF has published charts showing the percentage of students deemed proficient in various subjects and grade levels and compared them to percentages reported for each state by the National Assessment of Educational Progress (NAEP, or “The Nation’s Report Card”), considered to be the gold standard.