New York: Comparing schools and districts based on student proficiency
The information below reflects the most recent data available to us; please contact us with questions or to request additional analyses.
Analysis: Comparing schools and districts on third grade proficiency in reading and math
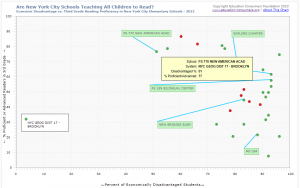
The charts linked below allow you to compare schools and districts in New York with their peers. The Y (vertical) axis shows the percentage of proficient 3rd graders in a subject; the X (horizontal) axis shows the percentage of students who qualify for the free or reduced rate lunch program, a common indicator of poverty in schools.
Available charts:
- All New York schools (including NYC): Poverty versus 3rd grade reading proficiency rates (2024)
- New York City: Poverty versus 3rd grade reading proficiency rates (2024)
- All New York schools (including NYC): Poverty versus 3rd grade reading proficiency rates (2022)
- New York City: Poverty versus 3rd grade reading proficiency rates (2022)
- All New York schools (including NYC): Poverty versus 6th grade reading proficiency rates (2022)
- All New York schools (including NYC): Poverty versus 7th grade reading proficiency rates (2022)
- All New York schools (including NYC): Poverty versus 8th grade reading proficiency rates (2022)
- All New York schools (including NYC): Poverty versus 3rd grade reading proficiency rates (2019)
- New York City: Poverty versus 3rd grade reading proficiency rates (2019)
- All New York schools (including NYC): Poverty versus 3rd grade reading proficiency rates (2018)
- New York City: Poverty versus 3rd grade reading proficiency rates (2018)
- All New York schools (including NYC): Poverty versus 3rd grade reading proficiency rates (2017)
- New York City: Poverty versus 3rd grade reading proficiency rates (2017)
- All New York schools (including NYC): Poverty versus 3rd grade reading proficiency rates (2016)
- New York City: Poverty versus 3rd grade reading proficiency rates (2016)
- All New York schools (including NYC): Poverty versus 3rd grade reading proficiency rates (2015)
- New York City: Poverty versus 3rd grade reading proficiency rates (2015)
- All New York schools (including NYC): Poverty versus 3rd grade reading proficiency rates (2013)
- New York City: Poverty versus 3rd grade reading proficiency rates (2013)
- All New York schools (including NYC): Poverty versus 3rd grade reading proficiency rates (2011)
- New York City: Poverty versus 3rd grade reading proficiency rates (2011)
Note: 2024 charts – The same statewide trendline was used on both the statewide and NYC only charts so that schools on either chart could be compared to state norms.
Note: For the 2019 chart, in a small number of schools the 2019 economically disadvantaged data was not available; for these schools, 2018 economically disadvantaged data was used.
Note: Charters were re-coded to be included in their home districts.
 Comparing New York’s Proficiency Standards to the National “Gold Standard” (NAEP)
Each state defines for itself what “proficient” means; some states have a rigorous definition, while others are less strict in their standards. To see how states compare, ECF has published charts showing the percentage of students deemed proficient in various subjects and grade levels and compared them to percentages reported for each state by the National Assessment of Educational Progress (NAEP, or “The Nation’s Report Card”), considered to be the gold standard.