Mississippi: Comparing schools and districts based on student proficiency
The information below reflects the most recent data available to us; please contact us with questions or to request additional analyses.
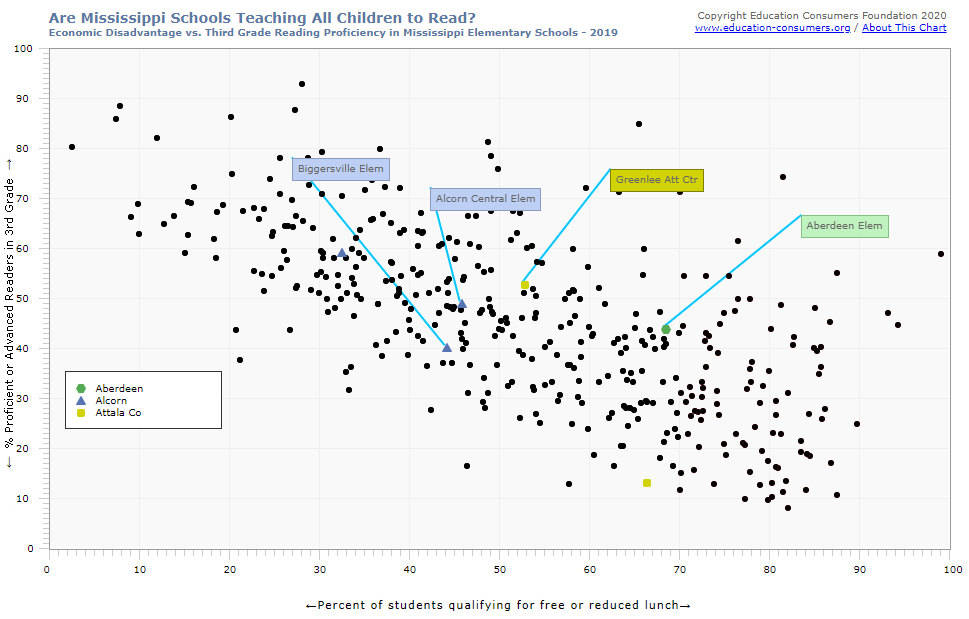
Analysis: Comparing schools and districts on third grade proficiency in reading and math
The Education Consumers Foundation is unable to create a school performance graphic for Mississippi schools. According to the Mississippi Department of Education, school performance data files that are made available to researchers in virtually every other state, cannot not be provided.
Available charts:
- Poverty versus 3rd grade reading proficiency rates (2024)
- Poverty versus 3rd grade reading proficiency rates (2022)
- Poverty versus 3rd grade reading proficiency rates (2019)
- Poverty versus 3rd grade reading proficiency rates (2018)
- Poverty versus 3rd grade reading proficiency rates (2017)
- Poverty versus 3rd grade reading proficiency rates (2016)
- Poverty versus 3rd grade reading proficiency rates (2015)
Note: For the 2016 and subsequent charts, the free and reduced lunch percentage is the Proxy Identified Student Percentage taken from the Community Eligibility Provision Annual Notification of Schools report. In the report, it states that the Proxy percent=number of directly certified students with SNAP/enrollment.
Note: Mississippi reports five levels of proficiency. The top two levels of proficiency, levels 4 and 5, were used to calculate proficiency.
Note: The 2015 E-rate for each school was used to calculate free and reduced lunch percentages.
 Comparing Mississippi’s Proficiency Standards to the National “Gold Standard” (NAEP)
Each state defines for itself what “proficient” means; some states have a rigorous definition, while others are less strict in their standards. To see how states compare, ECF has published charts showing the percentage of students deemed proficient in various subjects and grade levels and compared them to percentages reported for each state by the National Assessment of Educational Progress (NAEP, or “The Nation’s Report Card”), considered to be the gold standard.