Idaho: Comparing schools and districts based on student proficiency
The information below reflects the most recent data available to us; please contact us with questions or to request additional analyses.
Analysis: Comparing schools and districts on third grade proficiency in reading and math
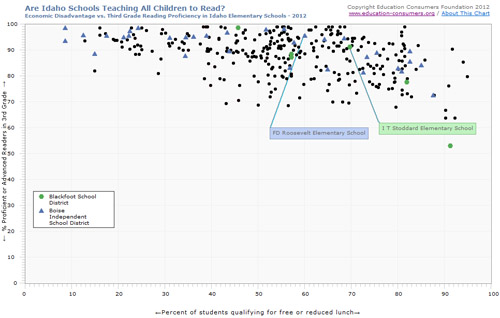
The charts linked below allow you to compare schools and districts in Idaho with their peers. The Y (vertical) axis shows the percentage of proficient 3rd graders in a subject; the X (horizontal) axis shows the percentage of students who qualify for the free or reduced rate lunch program, a common indicator of poverty in schools.
Available charts:
- Poverty versus 3rd grade reading proficiency rates (2022)
- Poverty versus 3rd grade reading proficiency rates (2019)
- Poverty versus 3rd grade reading proficiency rates (2018)
- Poverty versus 3rd grade reading proficiency rates (2017)
- Poverty versus 3rd grade reading proficiency rates (2016)
- Poverty versus 3rd grade reading proficiency rates (2013)
- Poverty versus 3rd grade reading proficiency rates (2012)
- Poverty versus 3rd grade math proficiency rates (2012)
- Poverty versus 3rd grade language arts proficiency rates (2012)
Note: In the case of missing percentages, ECF estimated the missing numbers in the proportions suggested by the state NAEP distribution.
Note: Free/reduced lunch percentages were calculated by dividing the total number of students tested by the number of students tested who received free or reduced lunch.
Note: In a small number of schools where school level F/RL data was not available, district data was substituted.
 Comparing Idaho’s Proficiency Standards to the National “Gold Standard” (NAEP)
Each state defines for itself what “proficient” means; some states have a rigorous definition, while others are less strict in their standards. To see how states compare, ECF has published charts showing the percentage of students deemed proficient in various subjects and grade levels and compared them to percentages reported for each state by the National Assessment of Educational Progress (NAEP, or “The Nation’s Report Card”), considered to be the gold standard.
Leave a Reply