Georgia: Comparing schools and districts based on student proficiency
The information below reflects the most recent data available to us; please contact us with questions or to request additional analyses.
Analysis: Comparing schools and districts on third grade proficiency in reading and math
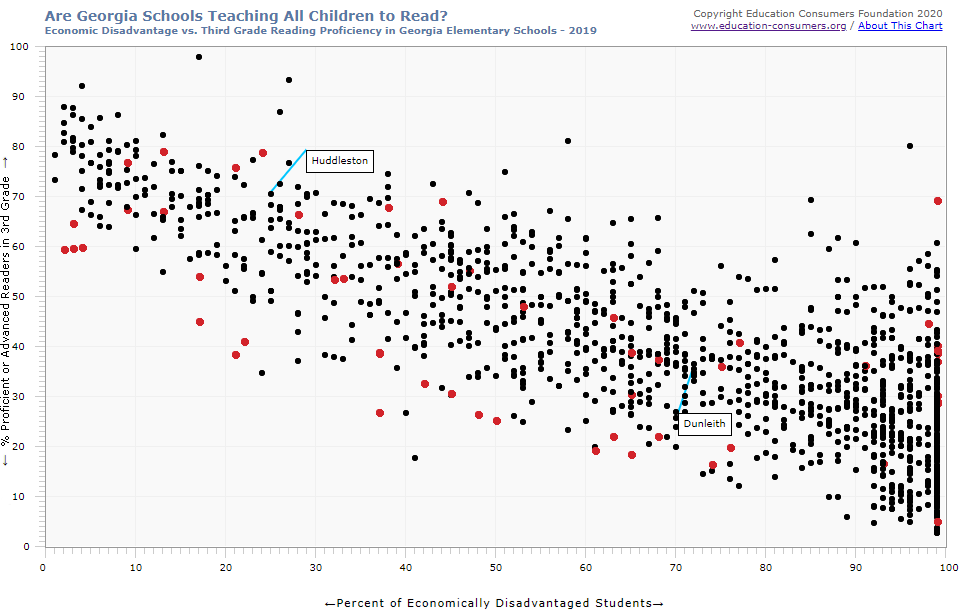
The charts linked below allow you to compare schools and districts in Georgia with their peers. The Y (vertical) axis shows the percentage of proficient 3rd graders in a subject; the X (horizontal) axis shows the percentage of students who qualify for the free or reduced rate lunch program, a common indicator of poverty in schools.
Because most schools have at least a small percentage of students with serious reading disabilities, most states have few schools with 95-100% proficiency rates. However, in the case of states where very many schools report proficiency rates in excess of 90%, ECF provides an additional chart showing the percentage of students who have reached the “advanced” level of reading performance, i.e., a chart showing the percentage of students who have reached a higher cut score on that state’s reading assessment. We believe that such a chart provides users a more nuanced view of reading achievement differences between schools in states with relatively low minimum standards.
Available charts:
- Proficient and Advanced: Poverty versus 3rd grade proficiency in reading and math (2024)
- Proficient and Advanced: Poverty versus 3rd grade reading proficiency (2022)
- Proficient and Advanced: Poverty versus 3rd grade reading proficiency (2021)
- Proficient and Advanced: Poverty versus 3rd grade reading proficiency (2019)
- Proficient and Advanced: Poverty versus 3rd grade reading proficiency (2018)
- Proficient and Advanced: Poverty versus 3rd grade reading proficiency (2017)
- Proficient and Advanced: Poverty versus 3rd grade reading proficiency (2016)
- Proficient and Advanced: Poverty versus 3rd grade reading proficiency (2015)
- Proficient and Advanced: Poverty versus 3rd grade reading proficiency (2014)
- Advanced Only: Poverty versus 3rd grade reading proficiency (2014)
- Proficient and Advanced: Poverty versus 3rd grade reading proficiency (2013)
- Advanced Only: Poverty versus 3rd grade reading proficiency (2013)
- Proficient and Advanced: Poverty versus 3rd grade reading proficiency (2011)
- Advanced Only: Poverty versus 3rd grade reading proficiency (2011)
Note for 2021: *Asterisks are reported next to school names in cases where the 2020-2021 tested population may not be representative of the total population based on prior achievement. Additional caution may be needed in interpretation and use in such cases. For more information on interpreting the 2020-2021 results of Georgia assessments, visit: https://www.gadoe.org/
Note: The Georgia Milestones Assessment System replaced the CRCT beginning with the 2014-2015 school year. Previous year results should not be compared to the 2015 and subsequent assessments.
 Comparing Georgia’s Proficiency Standards to the National “Gold Standard” (NAEP)
Each state defines for itself what “proficient” means; some states have a rigorous definition, while others are less strict in their standards. To see how states compare, ECF has published charts showing the percentage of students deemed proficient in various subjects and grade levels and compared them to percentages reported for each state by the National Assessment of Educational Progress (NAEP, or “The Nation’s Report Card”), considered to be the gold standard.