California: Comparing schools and districts based on student proficiency
The information below reflects the most recent data available to us; please contact us with questions or to request additional analyses.
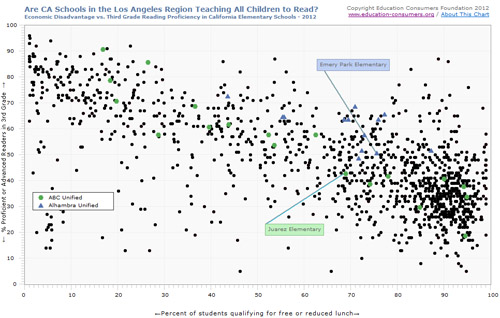
Analysis: Comparing schools and districts on third grade proficiency in reading and math
The charts linked below allow you to compare schools and districts in California with their peers. The Y (vertical) axis shows the percentage of proficient 3rd graders in a subject; the X (horizontal) axis shows the percentage of students who qualify for the free or reduced rate lunch program, a common indicator of poverty in schools.
Available charts:
- Chico/Redding Region: Poverty versus 3rd grade reading proficiency rates (2023)
- Chico/Redding Region: Poverty versus 3rd grade reading proficiency rates (2022)
- Chico/Redding Region: Poverty versus 3rd grade reading proficiency rates (2021)
- Chico/Redding Region: Poverty versus 3rd grade reading proficiency rates (2019)
- Chico/Redding Region: Poverty versus 3rd grade reading proficiency rates (2018)
- Chico/Redding Region: Poverty versus 3rd grade reading proficiency rates (2017)
- Chico/Redding Region: Poverty versus 3rd grade reading proficiency rates (2016)
- Chico/Redding Region: Poverty versus 3rd grade reading proficiency rates (2015)
- Chico/Redding Region: Poverty versus 3rd grade reading proficiency rates (2013)
- Chico/Redding Region: Poverty versus 3rd grade reading proficiency rates (2012)
- Eureka/Coastal Region: Poverty versus 3rd grade reading proficiency rates (2023)
- Eureka/Coastal Region: Poverty versus 3rd grade reading proficiency rates (2022)
- Eureka/Coastal Region: Poverty versus 3rd grade reading proficiency rates (2021)
- Eureka/Coastal Region: Poverty versus 3rd grade reading proficiency rates (2019)
- Eureka/Coastal Region: Poverty versus 3rd grade reading proficiency rates (2018)
- Eureka/Coastal Region: Poverty versus 3rd grade reading proficiency rates (2017)
- Eureka/Coastal Region: Poverty versus 3rd grade reading proficiency rates (2016)
- Eureka/Coastal Region: Poverty versus 3rd grade reading proficiency rates (2015)
- Eureka/Coastal Region: Poverty versus 3rd grade reading proficiency rates (2013)
- Eureka/Coastal Region: Poverty versus 3rd grade reading proficiency rates (2012)
- Los Angeles Region: Poverty versus 3rd grade reading proficiency rates (2023)
- Los Angeles Region: Poverty versus 3rd grade reading proficiency rates (2022)
- Los Angeles Region: Poverty versus 3rd grade reading proficiency rates (2021)
- Los Angeles Region: Poverty versus 3rd grade reading proficiency rates (2019)
- Los Angeles Region: Poverty versus 3rd grade reading proficiency rates (2018)
- Los Angeles Region: Poverty versus 3rd grade reading proficiency rates (2017)
- Los Angeles Region: Poverty versus 3rd grade reading proficiency rates (2016)
- Los Angeles Region: Poverty versus 3rd grade reading proficiency rates (2015)
- Los Angeles Region: Poverty versus 3rd grade reading proficiency rates (2013)
- Los Angeles Region: Poverty versus 3rd grade reading proficiency rates (2012)
- Los Angeles Region: Percentage of non-minority students versus 3rd grade reading proficiency rates (2011)
- Los Angeles Region: Percentage of Hispanic students versus 3rd grade reading proficiency rates(2011)
- Merced/Fresno Region: Poverty versus 3rd grade reading proficiency rates (2023)
- Merced/Fresno Region: Poverty versus 3rd grade reading proficiency rates (2022)
- Merced/Fresno Region: Poverty versus 3rd grade reading proficiency rates (2021)
- Merced/Fresno Region: Poverty versus 3rd grade reading proficiency rates (2019)
- Merced/Fresno Region: Poverty versus 3rd grade reading proficiency rates (2018)
- Merced/Fresno Region: Poverty versus 3rd grade reading proficiency rates (2017)
- Merced/Fresno Region: Poverty versus 3rd grade reading proficiency rates (2016)
- Merced/Fresno Region: Poverty versus 3rd grade reading proficiency rates (2015)
- Merced/Fresno Region: Poverty versus 3rd grade reading proficiency rates (2013)
- Merced/Fresno Region: Poverty versus 3rd grade reading proficiency rates (2012)
- Palm Springs Region: Poverty versus 3rd grade reading proficiency rates (2023)
- Palm Springs Region: Poverty versus 3rd grade reading proficiency rates (2022)
- Palm Springs Region: Poverty versus 3rd grade reading proficiency rates (2021)
- Palm Springs Region: Poverty versus 3rd grade reading proficiency rates (2019)
- Palm Springs Region: Poverty versus 3rd grade reading proficiency rates (2018)
- Palm Springs Region: Poverty versus 3rd grade reading proficiency rates (2017)
- Palm Springs Region: Poverty versus 3rd grade reading proficiency rates (2016)
- Palm Springs Region: Poverty versus 3rd grade reading proficiency rates (2015)
- Palm Springs Region: Poverty versus 3rd grade reading proficiency rates (2013)
- Palm Springs Region: Poverty versus 3rd grade reading proficiency rates (2012)
- Sacramento Region: Poverty versus 3rd grade reading proficiency rates (2023)
- Sacramento Region: Poverty versus 3rd grade reading proficiency rates (2022)
- Sacramento Region: Poverty versus 3rd grade reading proficiency rates (2021)
- Sacramento Region: Poverty versus 3rd grade reading proficiency rates (2019)
- Sacramento Region: Poverty versus 3rd grade reading proficiency rates (2018)
- Sacramento Region: Poverty versus 3rd grade reading proficiency rates (2017)
- Sacramento Region: Poverty versus 3rd grade reading proficiency rates (2016)
- Sacramento Region: Poverty versus 3rd grade reading proficiency rates (2015)
- Sacramento Region: Poverty versus 3rd grade reading proficiency rates (2013)
- Sacramento Region: Poverty versus 3rd grade reading proficiency rates (2012)
- Santa Barbara Region: Poverty versus 3rd grade reading proficiency rates (2023)
- Santa Barbara Region: Poverty versus 3rd grade reading proficiency rates (2022)
- Santa Barbara Region: Poverty versus 3rd grade reading proficiency rates (2019)
- Santa Barbara Region: Poverty versus 3rd grade reading proficiency rates (2018)
- Santa Barbara Region: Poverty versus 3rd grade reading proficiency rates (2017)
- Santa Barbara Region: Poverty versus 3rd grade reading proficiency rates (2016)
- Santa Barbara Region: Poverty versus 3rd grade reading proficiency rates (2015)
- Santa Barbara Region: Poverty versus 3rd grade reading proficiency rates (2013)
- Santa Barbara Region: Poverty versus 3rd grade reading proficiency rates (2012)
- San Diego Region: Poverty versus 3rd grade reading proficiency rates (2023)
- San Diego Region: Poverty versus 3rd grade reading proficiency rates (2022)
- San Diego Region: Poverty versus 3rd grade reading proficiency rates (2021)
- San Diego Region: Poverty versus 3rd grade reading proficiency rates (2019)
- San Diego Region: Poverty versus 3rd grade reading proficiency rates (2018)
- San Diego Region: Poverty versus 3rd grade reading proficiency rates (2017)
- San Diego Region: Poverty versus 3rd grade reading proficiency rates (2016)
- San Diego Region: Poverty versus 3rd grade reading proficiency rates (2015)
- San Diego Region: Poverty versus 3rd grade reading proficiency rates (2013)
- San Diego Region: Poverty versus 3rd grade reading proficiency rates (2012)
- Santa Clara Region: Poverty versus 3rd grade reading proficiency rates (2023)
- Santa Clara Region: Poverty versus 3rd grade reading proficiency rates (2022)
- Santa Clara Region: Poverty versus 3rd grade reading proficiency rates (2021)
- Santa Clara Region: Poverty versus 3rd grade reading proficiency rates (2019)
- Santa Clara Region: Poverty versus 3rd grade reading proficiency rates (2018)
- Santa Clara Region: Poverty versus 3rd grade reading proficiency rates (2017)
- Santa Clara Region: Poverty versus 3rd grade reading proficiency rates (2016)
- Santa Clara Region: Poverty versus 3rd grade reading proficiency rates (2015)
- Santa Clara Region: Poverty versus 3rd grade reading proficiency rates (2013)
- Santa Clara Region: Poverty versus 3rd grade reading proficiency rates (2012)
- San Francisco Region: Poverty versus 3rd grade reading proficiency rates (2023)
- San Francisco Region: Poverty versus 3rd grade reading proficiency rates (2022)
- San Francisco Region: Poverty versus 3rd grade reading proficiency rates (2021)
- San Francisco Region: Poverty versus 3rd grade reading proficiency rates (2019)
- San Francisco Region: Poverty versus 3rd grade reading proficiency rates (2018)
- San Francisco Region: Poverty versus 3rd grade reading proficiency rates (2017)
- San Francisco Region: Poverty versus 3rd grade reading proficiency rates (2016)
- San Francisco Region: Poverty versus 3rd grade reading proficiency rates (2015)
- San Francisco Region: Poverty versus 3rd grade reading proficiency rates (2013)
- San Francisco Region: Poverty versus 3rd grade reading proficiency rates (2012)
- Stockton Region: Poverty versus 3rd grade reading proficiency rates (2023)
- Stockton Region: Poverty versus 3rd grade reading proficiency rates (2022)
- Stockton Region: Poverty versus 3rd grade reading proficiency rates (2021)
- Stockton Region: Poverty versus 3rd grade reading proficiency rates (2019)
- Stockton Region: Poverty versus 3rd grade reading proficiency rates (2018)
- Stockton Region: Poverty versus 3rd grade reading proficiency rates (2017)
- Stockton Region: Poverty versus 3rd grade reading proficiency rates (2016)
- Stockton Region: Poverty versus 3rd grade reading proficiency rates (2015)
- Stockton Region: Poverty versus 3rd grade reading proficiency rates (2013)
- Stockton Region: Poverty versus 3rd grade reading proficiency rates (2012)
Note: Due to California’s’ large number of schools, the state has been divided into 11 geographic regions.
Note: The California State Board of Education voted to give California school districts the opportunity to use either state tests or other standards-aligned assessments to gauge student learning in 2021. Therefore, fewer schools are represented on the chart due to a lack of state assessment data.
 Comparing California’s Proficiency Standards to the National “Gold Standard” (NAEP)
Each state defines for itself what “proficient” means; some states have a rigorous definition, while others are less strict in their standards. To see how states compare, ECF has published charts showing the percentage of students deemed proficient in various subjects and grade levels and compared them to percentages reported for each state by the National Assessment of Educational Progress (NAEP, or “The Nation’s Report Card”), considered to be the gold standard.