The ECF cost calculator creates a back-of-an-envelope estimate of the tax burden placed on future generations by students who complete their K-12 schooling years either without a high school diploma or with a diploma that leaves them unprepared for college or a career. As adults, these students will face a lifetime of very limited employment opportunities and a predictable dependence on publicly funded services.
Relying on research by the Annie E. Casey Foundation and ACT, the calculator forecasts these outcomes from student reading proficiency at grade three. Approximately 70% of children who fail to read at a proficient level by grade three are destined to drop out or graduate unprepared for college or employment.
The challenge of empirically affirming and refining the calculator’s estimates is a project that developers, users, and scholars are only beginning to undertake. Initial findings, however, are promising.
The chart to the right (click to open as a PDF) represents the strength of the relationship between the calculator’s prediction of dropouts from 2003 reading data and the number of dropouts reported by the National Center for Educational Statistics (NCES) in 2010.
State-by-state percentages of 4th grade students reading at the Basic and Below-Basic levels were drawn from the 2003 National Assessment of Educational Progress (NAEP) and entered into the calculator along with then current enrollment data. The calculator’s predictions were then plotted against the number of NCES-reported dropouts for 2010 resulting in an R² of 0.92—an impressive statistical result. Because the calculator is concerned only with dropouts predictable from reading scores and because it does not attempt to adjust for increases in enrollment, the absolute size of its predictions tend to underestimate the observed outcomes.
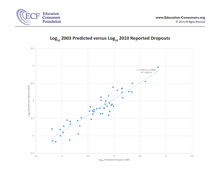 As the scatterplot of predicted versus reported dropouts reveals, both variables exhibit a strong positive skew—a condition that is appropriately corrected with scale transformations. The chart to the left displays Log10 Predicted versus Log10 Reported.
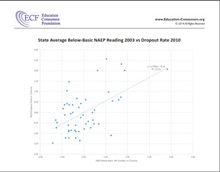
Given that a significant portion of the variance in the predicted number of dropouts appears to be attributable to enrollment outliers, ECF created a second chart (click chart below for a PDF version) describing the relationship between NAEP’s 2003 Below-Basic percentage and state dropout rates. Despite the necessity for score transformations and variety of statistical issues inherent in such a relationship, an R² of 0.31 was found—a finding that suggests a remarkably robust relationship between early reading failure and a critical school outcome.
 Other investigations are underway. A preliminary review of district level data appears to indicate that the greater variability of predictors and outcomes within a state would reduce the suppressive effects of the truncated data ranges found in the present report.
Despite these and a host of other complexities and limitations, the present data are consistent with the conclusion that the ECF calculator provides estimates of sufficient accuracy to broaden public appreciation of early reading skills and awareness of the significant tax reduction that early reading improvement in any local school can bring about.