How Effective are Tennessee’s Teacher Preparation Programs?
Tennessee’s Value Added Assessment System has been in place since 1995. It enables users to estimate the success of teachers, schools, and districts in lifting student achievement and it does so in a way that permits statistically fair comparisons.
Since 2007, the Tennessee Higher Education Commission has published a report card that uses the TVAAS data to estimate success of Tennessee’s teacher preparation programs in graduating “highly effective” new teachers. Highly effective new teachers are ones who are able bring about as much student learning per year as top-performing veteran teachers. Highly ineffective teachers are ones who bring about the same learning gains per year as the State’s least effective veteran teachers. The teacher classification is based on the first 3 years of teaching.
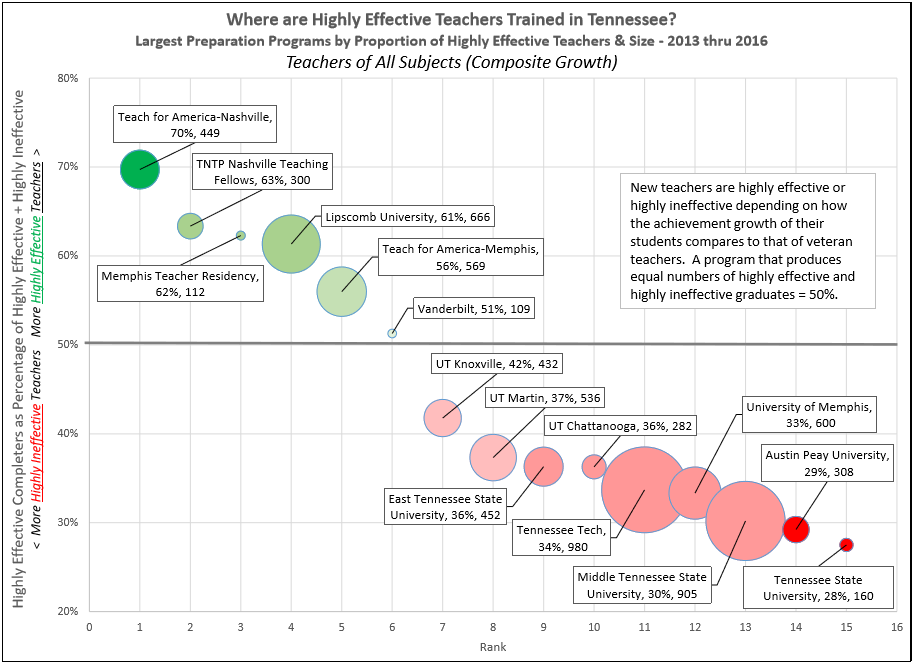
With the notable exceptions of Teach For America, Lipscomb University, and a few of the smaller programs, Tennessee’s teacher trainers are producing more “highly ineffective” teachers than “highly effective.”
January 2018
Chart is based on the TVAAS-based teacher-effect data available from Tennessee’s 2013-2015 teacher preparation report cards plus the 2016 teacher effect data available by request from the Tennessee State Board of Education.
Charts Below are Based on 2013-2015 Data Only
Click charts to download in pdf
Teacher Preparation Effectiveness
2013-2015
The TVAAS “teacher effect” scores earned by each teacher during their first three years of teaching were aggregated for the graduates of each preparation program. A statistical analysis classified each teacher as highly effective, average, or highly ineffective and the number of teachers in each classification were summed and reported annually for each program.
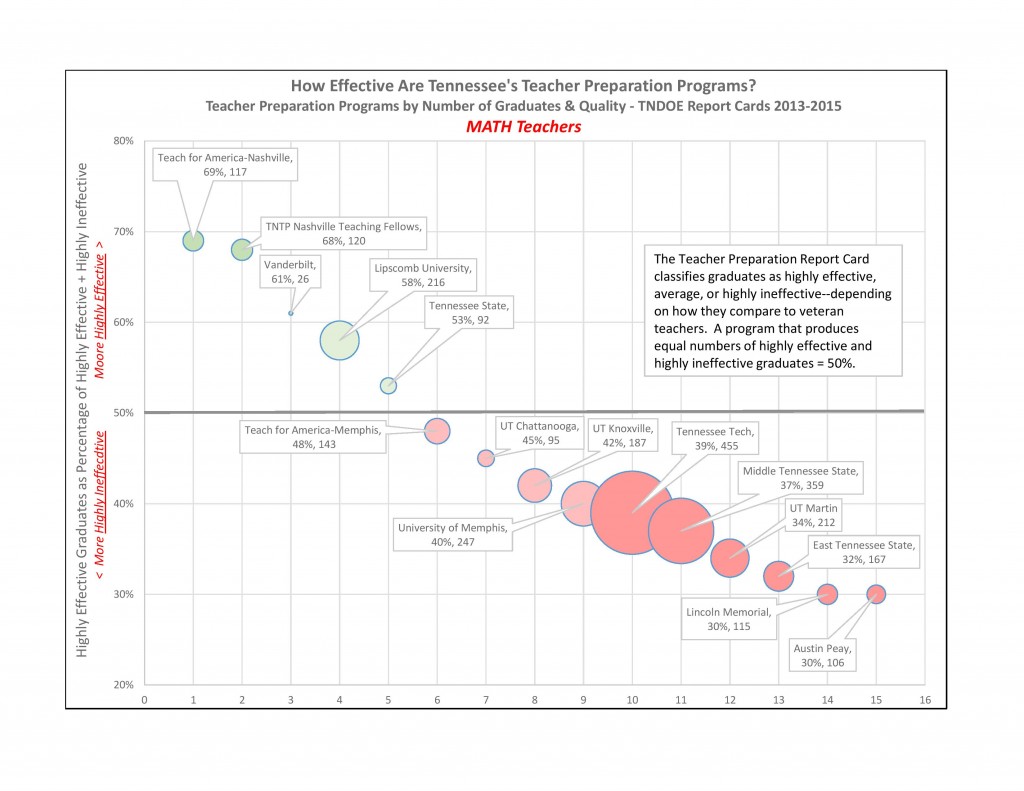
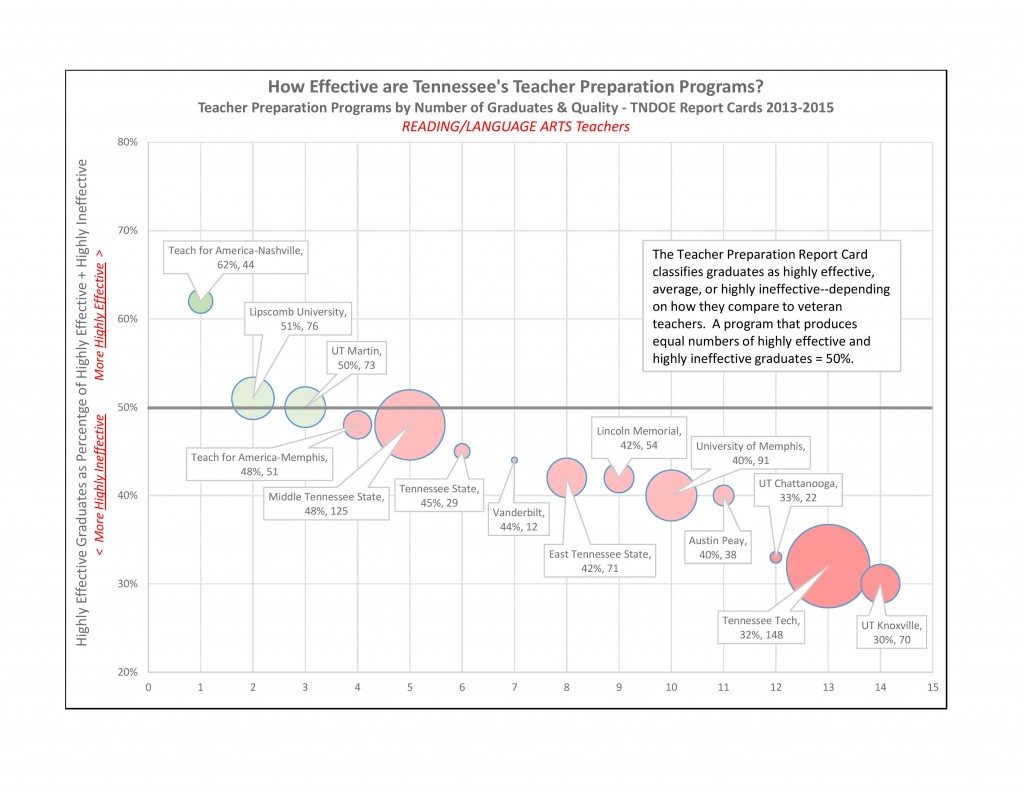
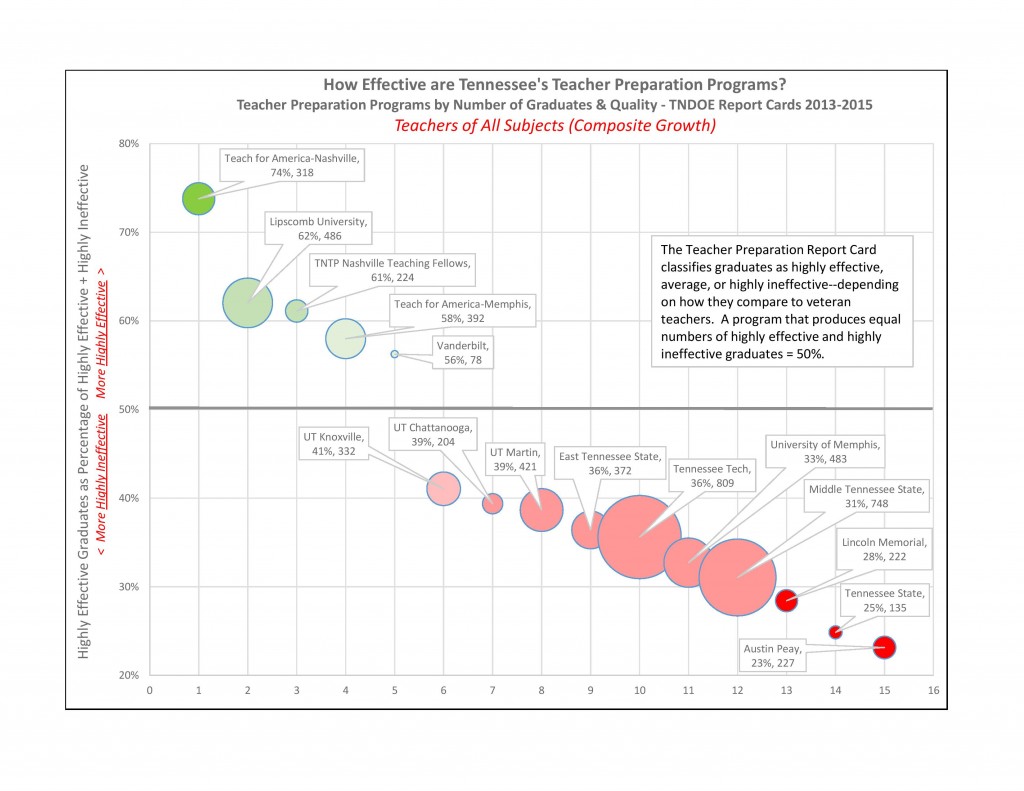
The three charts shown above are based on the 2013-2015 Teacher Preparation Report Cards (now) published by the Tennessee Department of Education. The data are aggregated from the “TVAAS Analysis of Apprentice and Transitional License Teachers” table in the subject matter categories of Math, Reading/Language Arts, and Composite.
Report Cards are available for all of Tennessee’s 43 teacher preparation programs, however, the charts below include only those programs housed in the State’s public universities and selected others.
Teachers (i.e., program completers) whose achievement gain scores would place them in the bottom quintile of veteran teachers are described as “highly ineffective“–following the terminology used in Appendix B of the Report Card. Teachers whose scores would fall in the top quintile of the veteran distribution are described as “highly effective.” Teachers whose scores would fall in middle 3 quintiles are described as “average.” The “number of graduates” is the number of “teachers” reported in the TVAAS Analysis table.
The chart defines the “quality” of each program as the number of highly effective graduates divided by the total of highly effective plus highly ineffective graduates times 100. This definition reflects the standing of each program with regard to Tennessee’s policy aims of maximizing the number of new teachers who are highly effective and minimizing the number who are highly ineffective.


