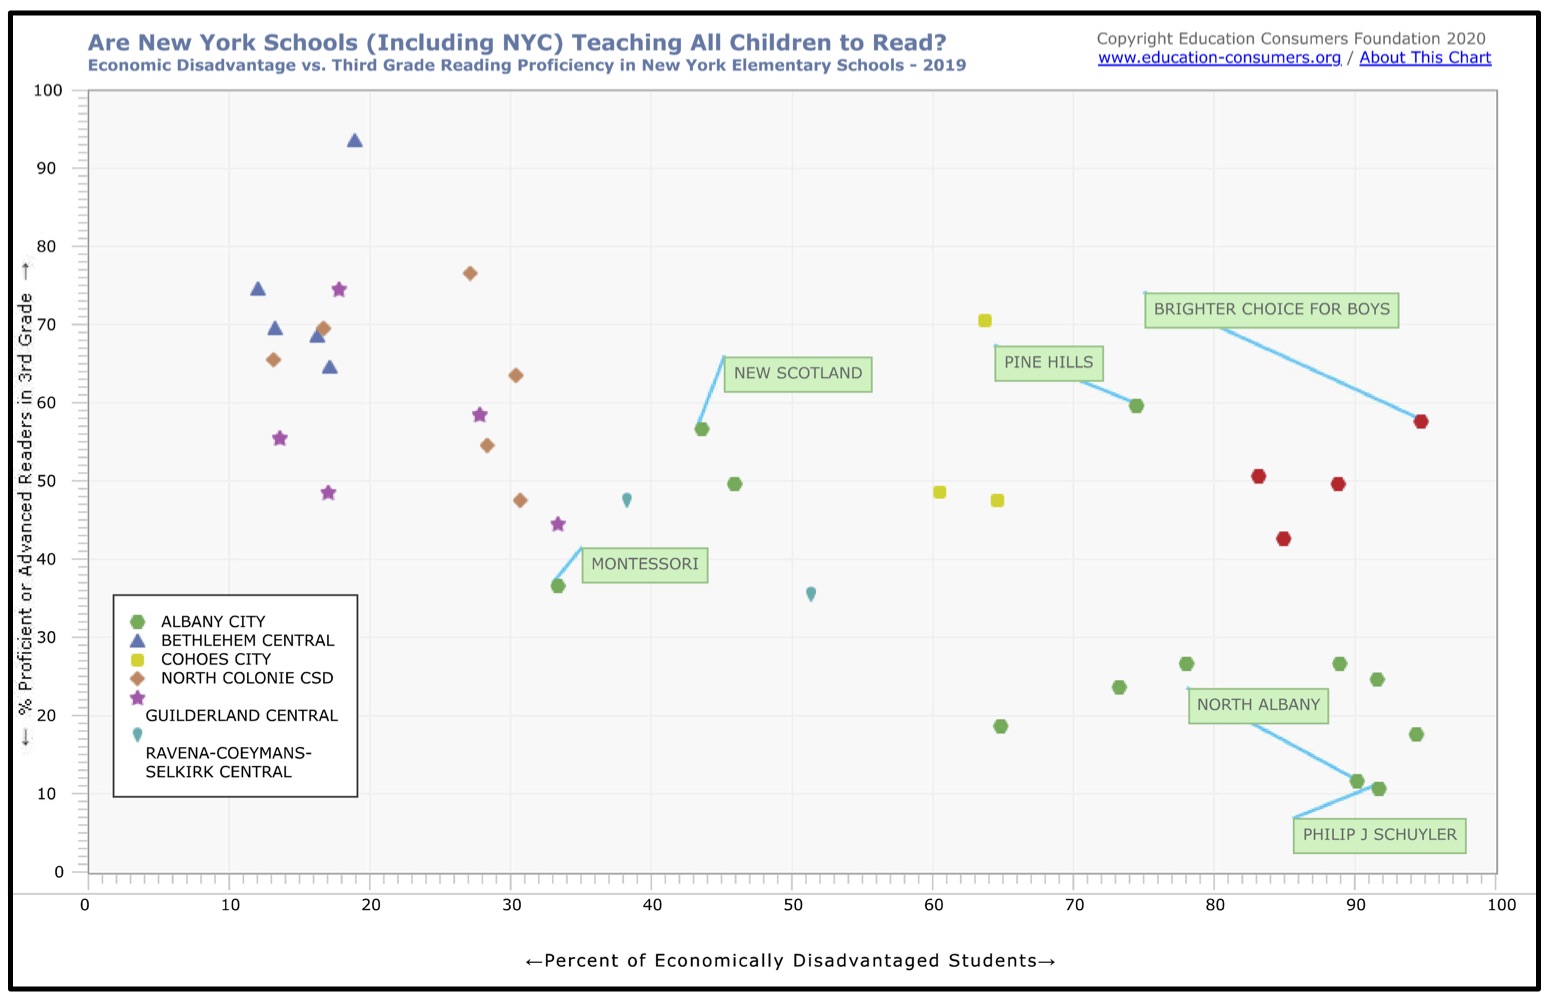
The chart above displays the percentage of proficient readers in each of the 37 schools comprising Albany County, NY’s six school districts. The green dots are the Albany City Schools. The red dots are the Albany City charter schools.
If you were willing to locate anywhere in Albany County, you would probably choose one of the districts with top-performing schools. If, however, you were limited to the Albany district, the sample chart would provide useful guidance.
The closer a school is to the top of the chart, the higher the school’s percentage of proficient third graders and the greater your child’s chances of success. The further to the right, the higher the school’s percentage of economically disadvantaged students.
New Scotland, Pine Hills, and Brighter Choice have roughly equal outcomes. If your child is in the average range of reading readiness, any one of the 3 would be a reasonable choice. Any of the three would be a better choice than North Albany and Schuyler.
If your child’s initial reading readiness is below average, Brighter Choice or Pine Hills could be a better choice because they have high percentages of proficient readers despite their percentages of economically disadvantaged students, i.e., students who typically have lower reading readiness at school entry. For less prepared students to rise to a proficient level, their annual achievement growth must be greater than one year/year- an outcome that requires exceptionally effective teaching.
Of the other schools in the Albany district, it is noteworthy that the four charter schools (red dots) are outperforming most of the district despite their higher numbers of disadvantaged students--an indication that they are producing above-average achievement growth. By contrast, the Montessori school is underperforming relative to its demographic peers.
For more on how to assess local schools, read: What to look for and why.
What these charts reveal about learning to read in your state To get a bird’s-eye view of the schools in your state, click “All Schools.” In every state, you will see that a large percentage of schools struggle to teach reading—especially schools with high numbers of economically disadvantaged children. Nationally, only a third of students are proficient by 3rd grade. Less than 20% of minorities reach that level. There are important exceptions, however, and they are the living proof that wider use of effective teaching could make a profound difference.
First, notice that huge numbers of schools are turning out children who have not reached the proficient level of reading by 3rd grade. This fact is at the heart of most of America’s educational (and economic competitiveness) problems.
Move your cursor across the dots and use the “Select Schools” button to see names and districts. Click “Start” to see your options.
Second, notice that there is a strong relationship between economic disadvantage and 3rd-grade reading proficiency. The great majority of below-proficient readers are economically disadvantaged children—both white and minorities. The reason is that disadvantaged children typically enter school one or two grade levels behind their peers. For them to reach proficiency by grade 3, their knowledge and skills have to grow by more than one year per school year—a teaching challenge that requires highly effective teachers.
Third, notice that some schools substantially exceed the performance of their demographic peers while others fall well short. These differences in outcomes frequently (but not always) represent important differences in the effectiveness of the school’s reading instruction. Disadvantaged children can become proficient readers by third grade when they have highly effective teachers, i.e., teachers who have been trained to deliver high achievement growth.
A wealth of evidence suggests that the early use of intensive, skill-focused reading instruction could enable the vast majority of at-risk children to reach grade level by 3rd grade. Click here for ECF’s recommendations.
At 3rd grade, schooling changes from learning-to-read to reading-to-learn. Children who have not mastered reading by that point are educationally disadvantaged for a lifetime. Without remediation, they are unlikely to optimally profit from subsequent schooling or become all they could be in life. Schools and teachers overloaded with struggling readers are inevitably impeded in their efforts to bring all students to grade-level standards.
The data displayed for each state is downloaded from official state sources. Click each state’s “About this Chart” for details and links to sources.
State tests differ with respect to standards (i.e., expected knowledge and skill levels), with respect to scale scores defined as “proficient,” and even with respect to the terminology used to designate reading performance levels. Most states, however, follow the practice of the National Assessment of Educational Progress (NAEP) which defines “proficient” or “advanced” as students who have mastered reading and “basic” or “below basic” as students who have fallen short of mastery. Differences in the terminology used by individual states are noted on the individual state index pages.
Because most schools have at least a small percentage of students with serious reading disabilities, most states have very few schools with 95-100% proficiency rates. In the case of those states where a large number of schools do report proficiency rates in excess of 90%, ECF provides an additional chart showing the percentage of students who have reached an “advanced” level of reading performance. We believe that an extraordinary percentage of proficiency rates in excess of 90% may reflect a low proficiency standard and that a chart displaying students who have reached the “advanced” level may provide users a more nuanced view of the state’s reading achievement differences.